

METRICS THAT MATTER
Measure Improvement and Focus on Impact
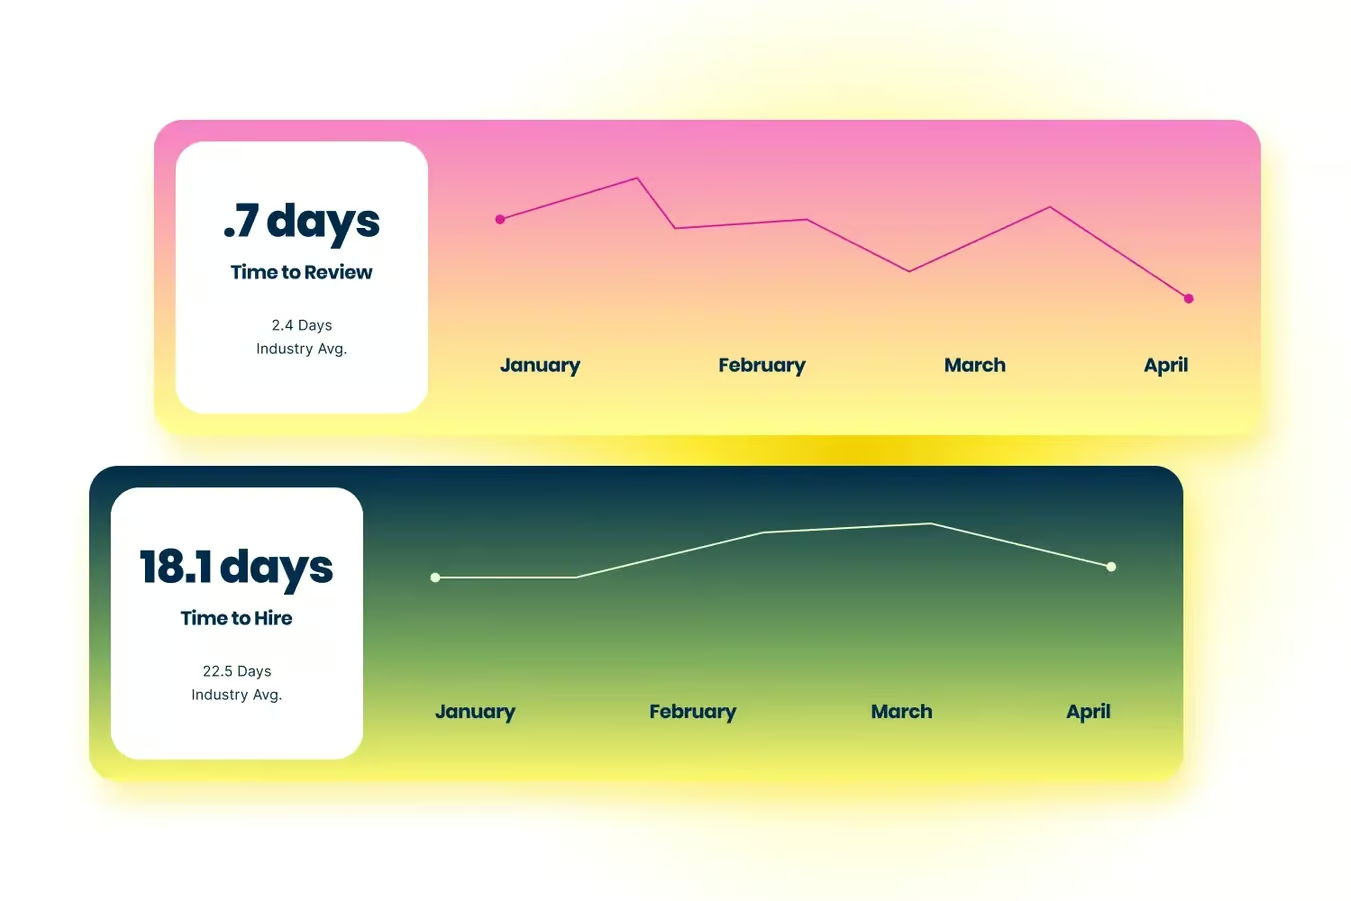
Hiring Velocity
Hireology presents managers with a flexible, scalable system that sorts fast and accelerates access to top talent.
Prescreen surveys and filters spot high-potential applicants the moment they apply
Mobile-first processes keep hiring in motion
Built-in structure and guidelines support quick and confident decisions
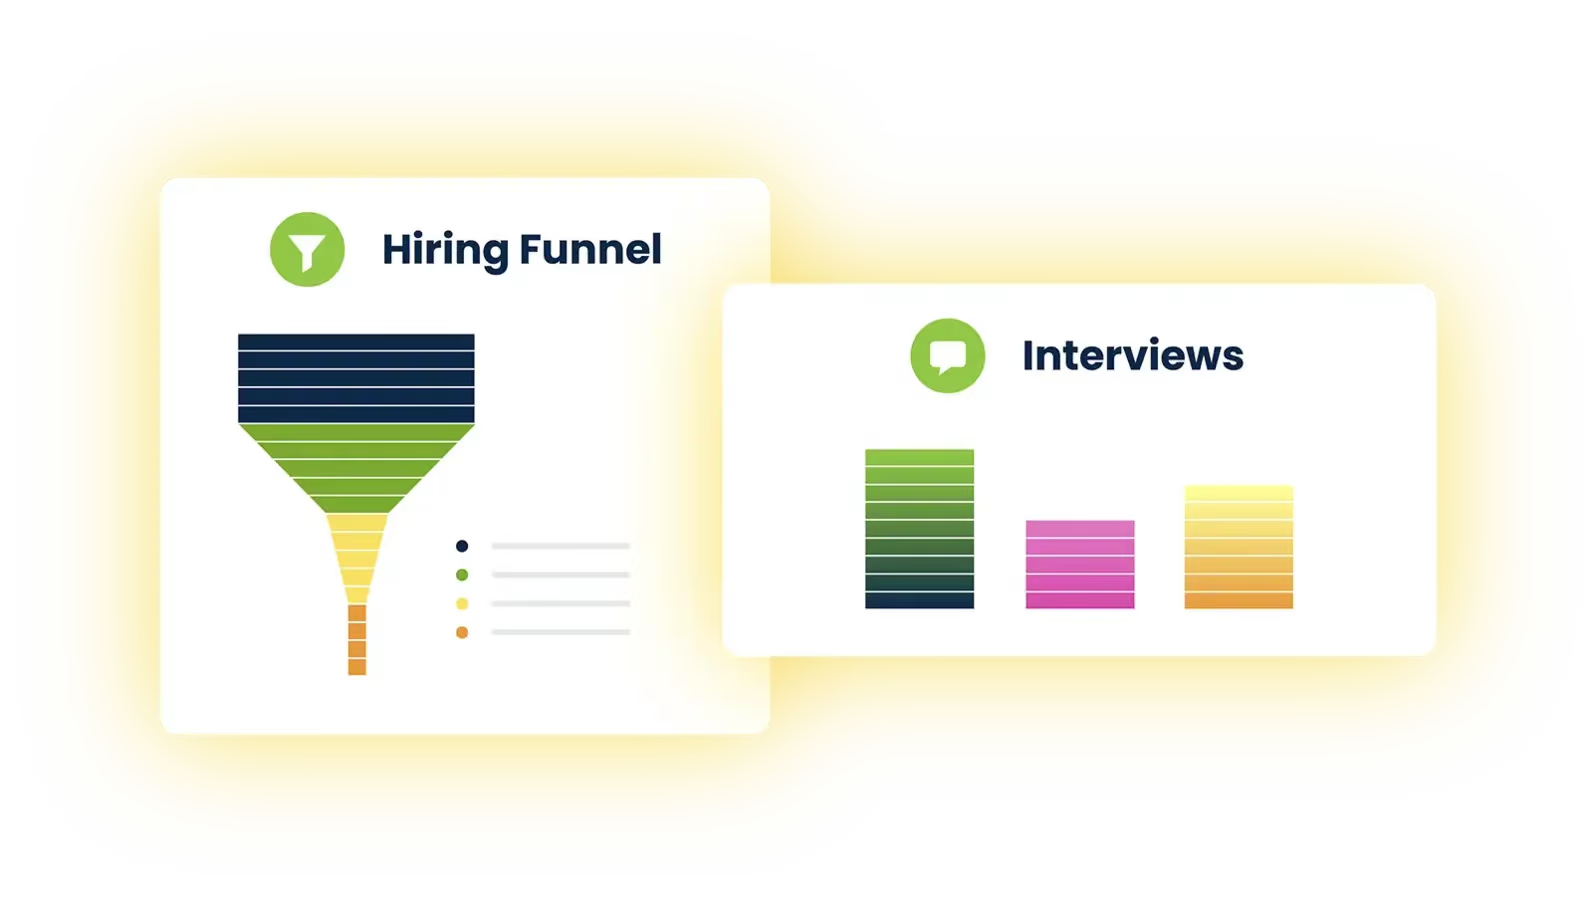
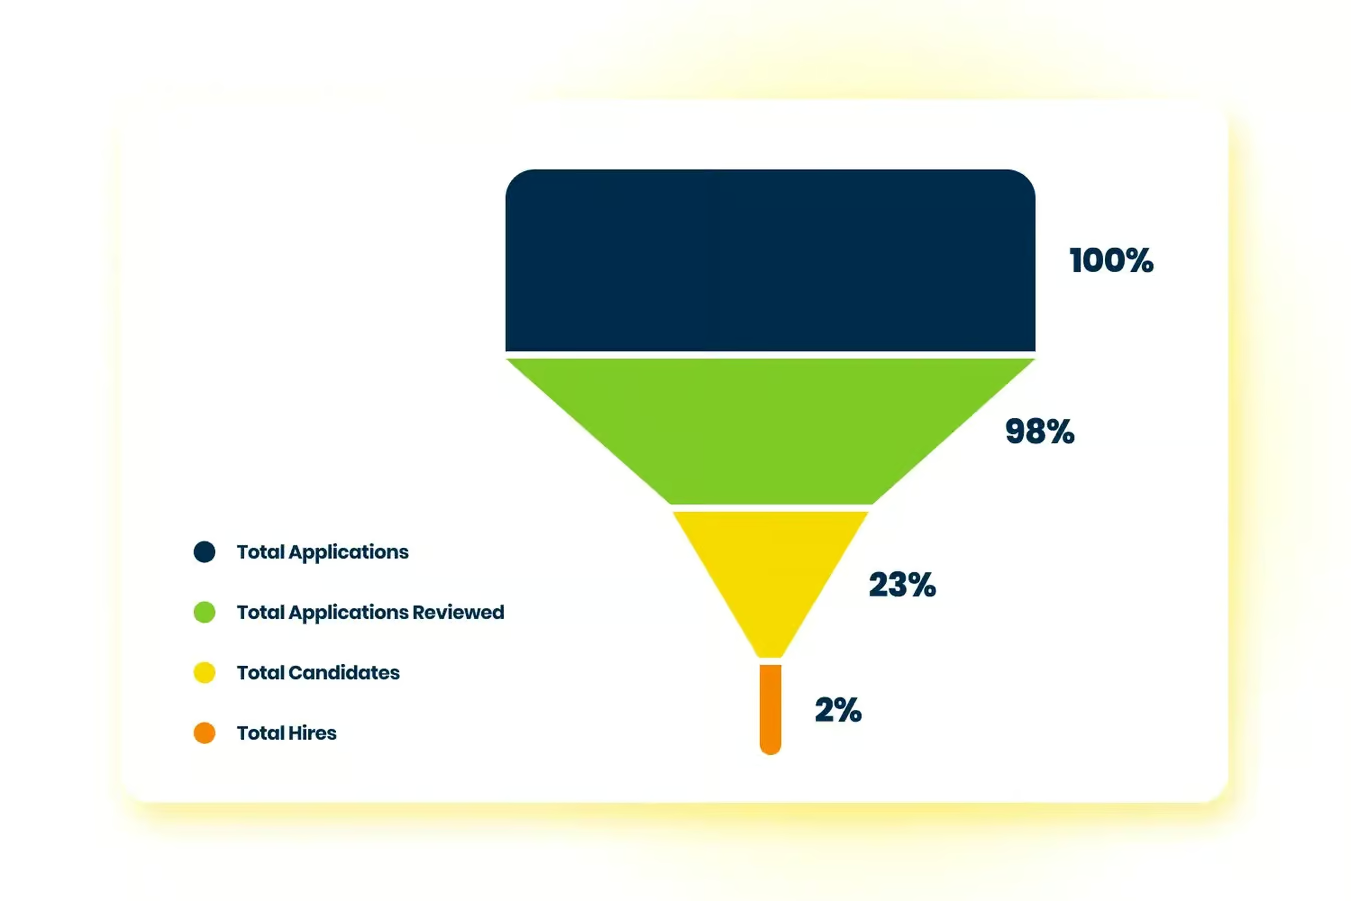
Hiring Funnel
Hireology helps build and optimize a hiring portfolio – balancing high-converting channels, targeted spending, and consistent outreach to attract more of the right-fit candidates.
Automated alerts when candidates enter key stages of the funnel
Structured employee referral programs that deliver trusted candidates
Automated re-engagement of past applicants who already know your brand
Clear visibility that removes guesswork and powers process improvement
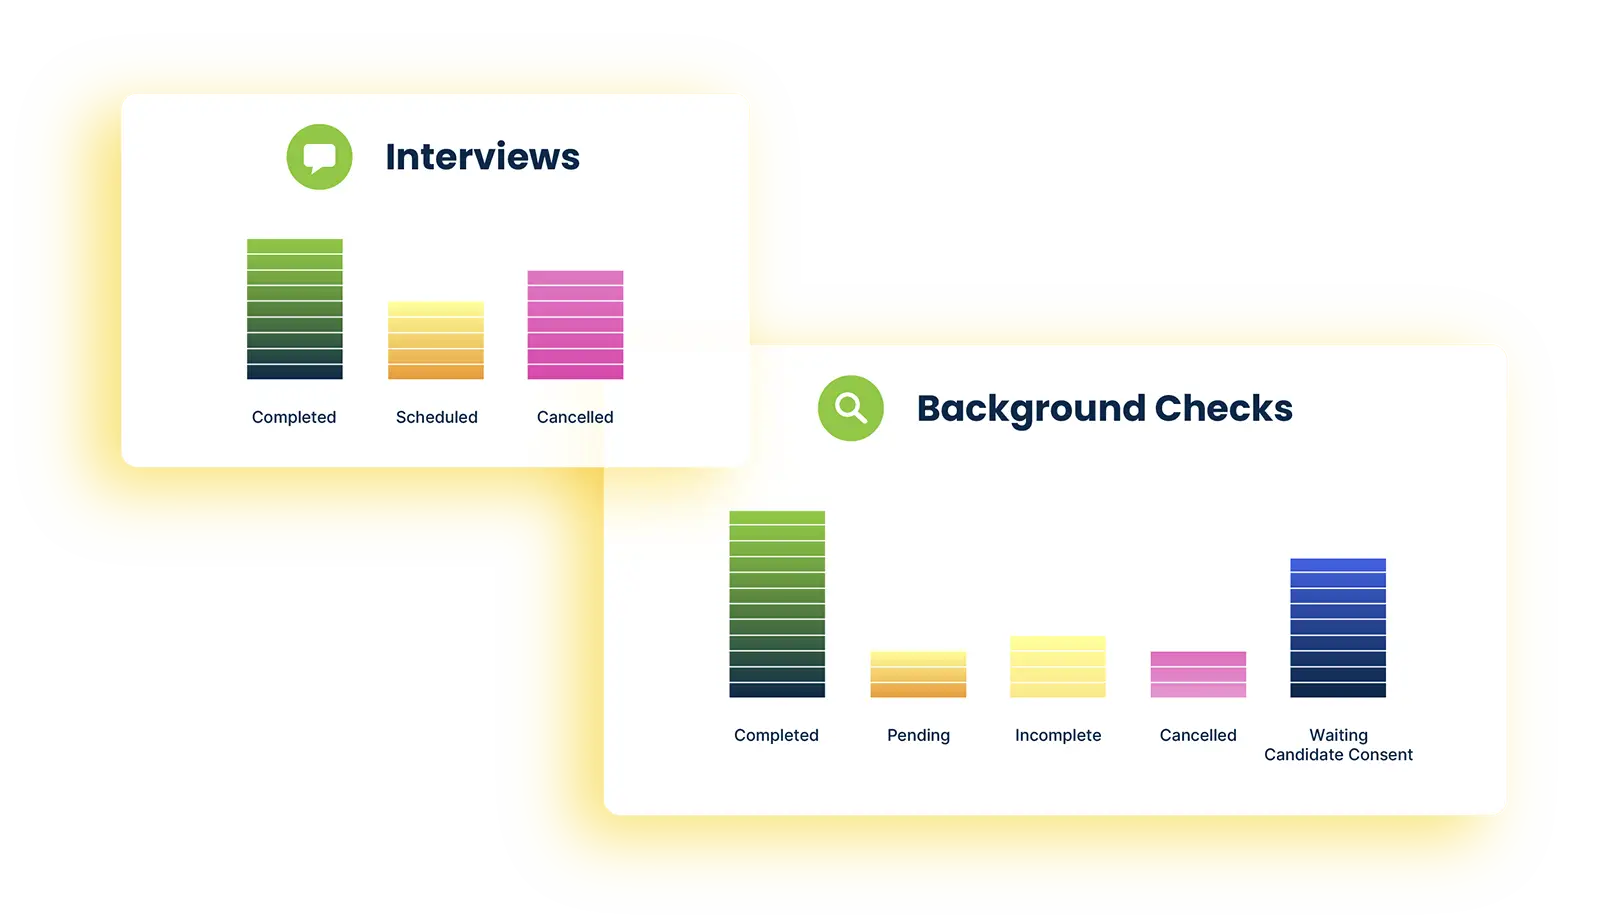
Hiring Steps
Once teams adopt the platform, standardization happens naturally. Shared templates, structured steps, and built-in automations help every location hire more efficiently and effectively.
Hiring workflows that guide managers through the right steps
Structured interview guides that promote fairness and alignment
Approvals and compliance checks that protect your business
Sourcing Performance
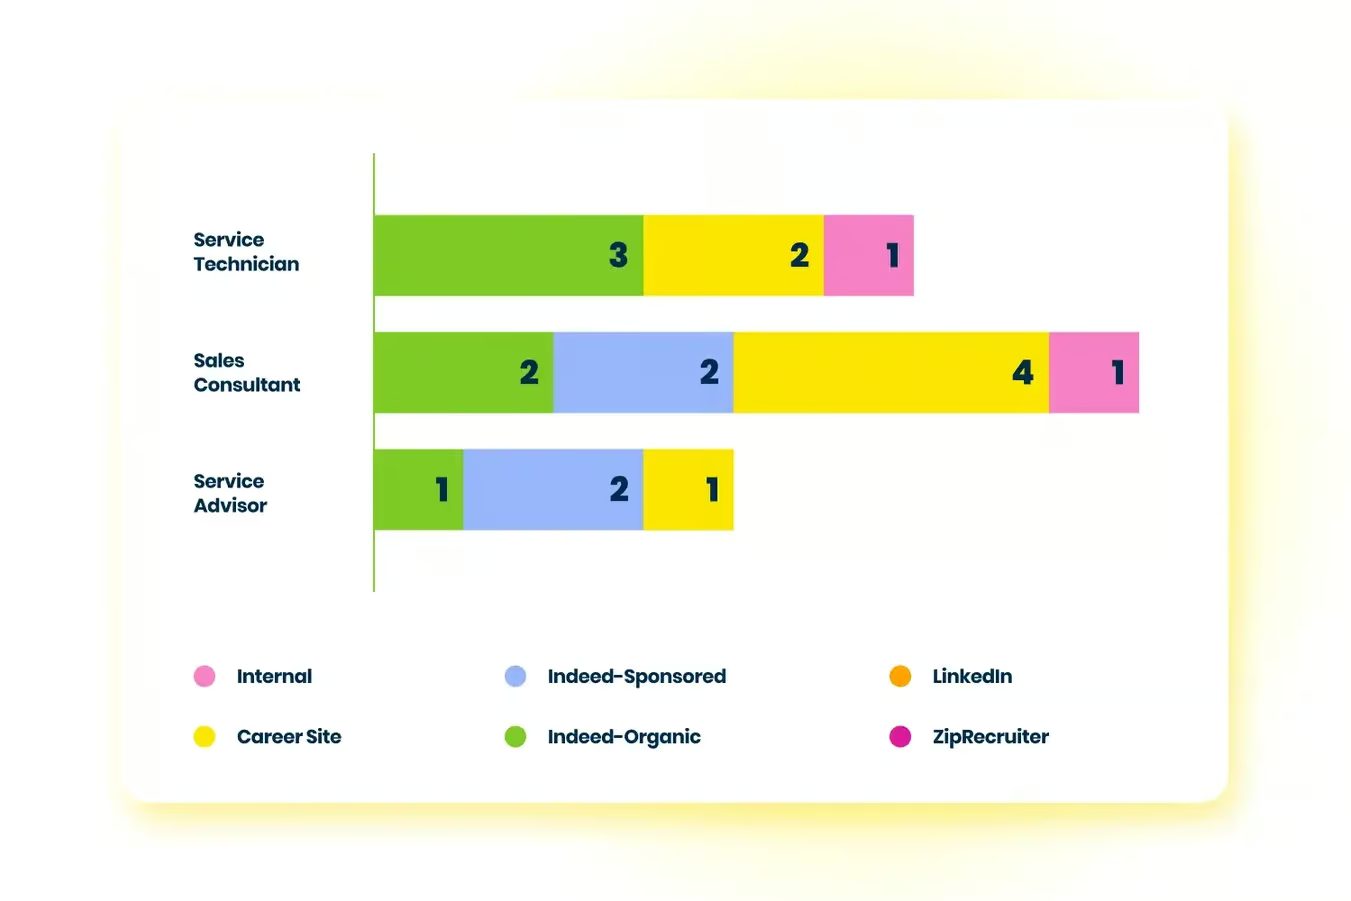
Compare hiring performance across locations with real-time insights that monitor what’s working, help you to allocate resources accordingly, and improve over time.
Source performance tracking tied to actual hires
Role- and location-specific insights to guide local adjustments
ROI reporting that keeps strategy aligned to results
User Activity
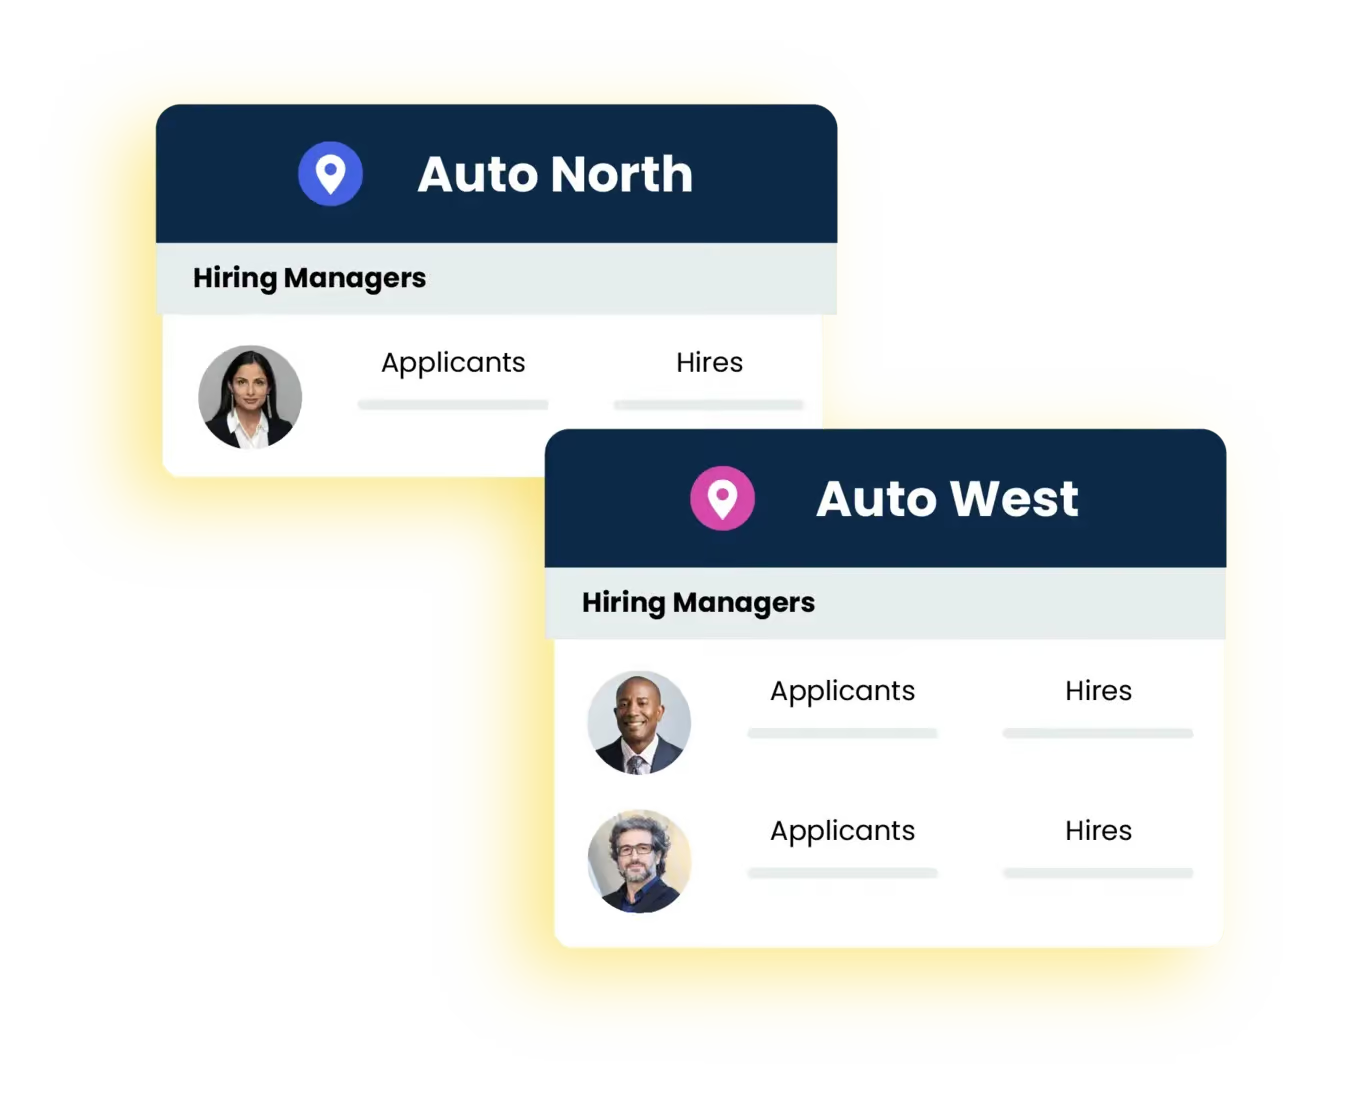
When some teams move fast and others stall, Hireology helps you understand why, and brings consistency to the process.
Role- and team-based benchmarking
Reports that highlight process gaps and operational outliers
Visibility into how tools and workflows are being used
Alerts for delayed actions or missing steps
Key Solutions
How They’ve Performed
2.3
Reduction in time-to-hire using SMS (days)
2
Reduction in time-to-hire using Action Center (days)
4%
Interview to Offer Letter Conversion Rate