
U.S. employers added 165,000 jobs in October, according to the Bureau of Labor Statistics. In the same month, new job postings fell 4.2% to 3.80 million, according to Lightcast. Hiring picked up while new openings pulled back, and almost all of the gain came from four industries.
This report combines three sources. The Bureau of Labor Statistics (BLS) Employment Situation is the monthly federal jobs report, which counts how many jobs employers added and what share of workers are unemployed. Lightcast is a labor market data firm that collects job postings from many online sources and tracks how many are new, how long they stay live, and what they pay, so it shows what employers are advertising right now. Hireology platform data adds what neither can: real operator behavior, meaning how fast employers review applicants, reach out, and hire.
In October, employers on our platform received 566,848 applications and recorded 19,083 hires. Our September platform data lets us show the trend, and speed did not improve. Here is where hiring stands heading into the holidays, what to change this week if you are hiring now, and where AI and offer automation shorten the wait.
October's Job Gain
Payrolls grew by 165,000 in October, well above the prior 12-month average gain of 48,000. September's first read of 29,000 was too low. In the October report, BLS revised September to 60,000 and August from 133,000 to 186,000, which puts the two months 84,000 higher combined.
- Nonfarm payroll change:
- +29,000 in September as first reported (revised to +60,000)
- +165,000 in October
- Unemployment rate:
- 4.2% in September
- 4.1% in October
- Labor force participation rate:
- 61.8% in September
- 61.9% in October
New Postings Fell 4.2% in October
Lightcast counted 3,797,967 unique new postings in October, down 164,788 from September's 3,962,755. October 2025 came in at 3,759,270, so postings are up 1% year over year. In September the same comparison showed 6.6% growth. BLS counts net jobs added and Lightcast counts new postings, so the two can move in opposite directions in the same month. The 7.01 million total postings covered 3.80 million unique jobs, a posting intensity of 2:1, the same ratio as September. Posting intensity is total postings divided by unique jobs. It shows how often the same opening is advertised, whether across several job boards or through reposting. Pay is the biggest gap in the data. Only 49% of postings, 1.877 million of 3.798 million, advertised a salary. Among those that did, the median was $68.5K.
A quarter of October applicants were never reviewed, and speed did not improve from September
Hireology customers reviewed 72.5% of October applicants, down from 74.5% in September. That leaves 27.5% unreviewed, roughly 156,000 of the 566,848 who applied, compared with about 149,000 of 583,993 the month before. Employers recorded 19,083 hires, down 3.8% on a 2.9% drop in applications, or roughly one hire for every 30 applicants in both months.
- Applicants:
- 583,993 in September
- 566,848 in October (-2.9%)
- Hires:
- 19,827 in September
- 9,083 in October (-3.8%)
- Applicants reviewed:
- 74.5% in September
- 72.5% in October (-2.0 points)
The clock edged up at nearly every step before the hire. Time to hire rose from 15.0 to 15.7 days, first outreach from 6.7 to 6.9, and interview scheduling from 8.0 to 8.1. Review time held near 3.2 days. Only onboarding improved, falling from 9.0 to 7.5 days. (Hireology averages cap extreme values.)
The diagnosis is a handoff problem. Review happens in about three days, and outreach takes nearly four more. A 6.9-day wait for first outreach is more than half the life of a typical 12-day posting. Applications fell 2.9% and speed still did not improve, which points at process, not workload. These averages come from different groups of applicants, so read the gap as a direction, not a stopwatch.
Response Time Decides Who Wins
Put the three sources side by side. Unemployment is 4.1%, which is 7.1 million people. Another 4.8 million are working part time and want full-time hours, and 6.0 million are outside the labor force and say they want a job. Applicants are not scarce. Hireology employers took in 566,848 applications in one month.
Competition for them is uneven. Four industries produced 156,000 of the 165,000 net jobs, so employers hiring nurses and home health aides are bidding against that surge. Although, hospitality showed little change in October payrolls.
Wages are moving at a steady pace. Average hourly earnings rose 0.4% in October to $38.00 and are up 3.1% over 12 months. Half of postings still show no pay, which leaves candidates guessing where your offer sits.
Industry Focus
Healthcare
Healthcare added 42,000 jobs in October, up from 17,000 in September's first read and above its 12-month average of 31,000. Hospitals contributed 16,000, home health care 11,000, and outpatient care centers 5,000.
Registered nurse is the most posted occupation in the country, with a median posting duration of 11 days. On Hireology, the average RN hire took 36.1 days and the average home health aide hire took 41.1 days, the two longest time-to-hire figures on the dashboard. Review is not the slow step for either role: RN applicants waited 3.4 days for review and home health aides 3.2. Plan these pipelines around a five-to-six-week hire, and look at interview scheduling and offers first.
Automotive
Lightcast shows 24,723 unique postings for automotive service technicians in October, with a median posting duration of 13 days. In Hireology data, a shop foreman took 27.6 days to hire, a diesel technician 19.0, a service technician 17.7, and a service advisor 17.1. Service technician applicants were reviewed at an 82.5% rate against 72.5% overall, so the inbox is not where service departments lose time. The weeks after review are.
Hospitality
Leisure and hospitality showed little change in October. Limited-service restaurants posted 49,358 unique jobs at an 11-day median, and cooks, waiters, and housekeepers sit at 13 to 14 days. Hospitality applicants wait longest to be seen. Valets waited 9.2 days for a review, banquet bartenders 7.2, hotel room attendants 5.2, and servers 4.7, against 3.2 days overall. Only 67.7% of server applicants and 71.0% of room attendant applicants were reviewed at all. After review, hires move fast: 11.9 days for a server, 10.9 for a room attendant, and 6.6 for a line cook.
Where AI and Offer Automation Shorten the Wait
The slowest steps in the platform data come before a person talks to a candidate: review at 3.2 days, first outreach at 6.9, and an interview on the calendar at 8.1. Hireology's AI features are built for those steps. Hireology reports that customers using AI see 47% faster time to review and 24% faster time to hire.
AI Match scores each applicant against the attributes you set for the role and shows the evidence behind the score, so a manager can sort a full inbox by fit instead of reading in arrival order. AI Candidate Summary condenses each candidate into strengths, gaps, and key signals, and drafts interview questions for the areas worth probing. Both work on the review step, where 27.5% of October applicants stalled.
AI Interview handles the first conversation. Candidates complete a structured interview by SMS or email on their own schedule, at any hour, in multiple languages, and you get rubric-based evaluations with transcripts to review. A first conversation can start without waiting on a manager's calendar, which is the wait behind the 6.9-day first-outreach average.
Pilot it where the data says the wait is longest: servers and hotel room attendants, who waited 4.7 and 5.2 days for review, and RNs, whose hires averaged 36.1 days.
Losing Potential Hires at the Offer
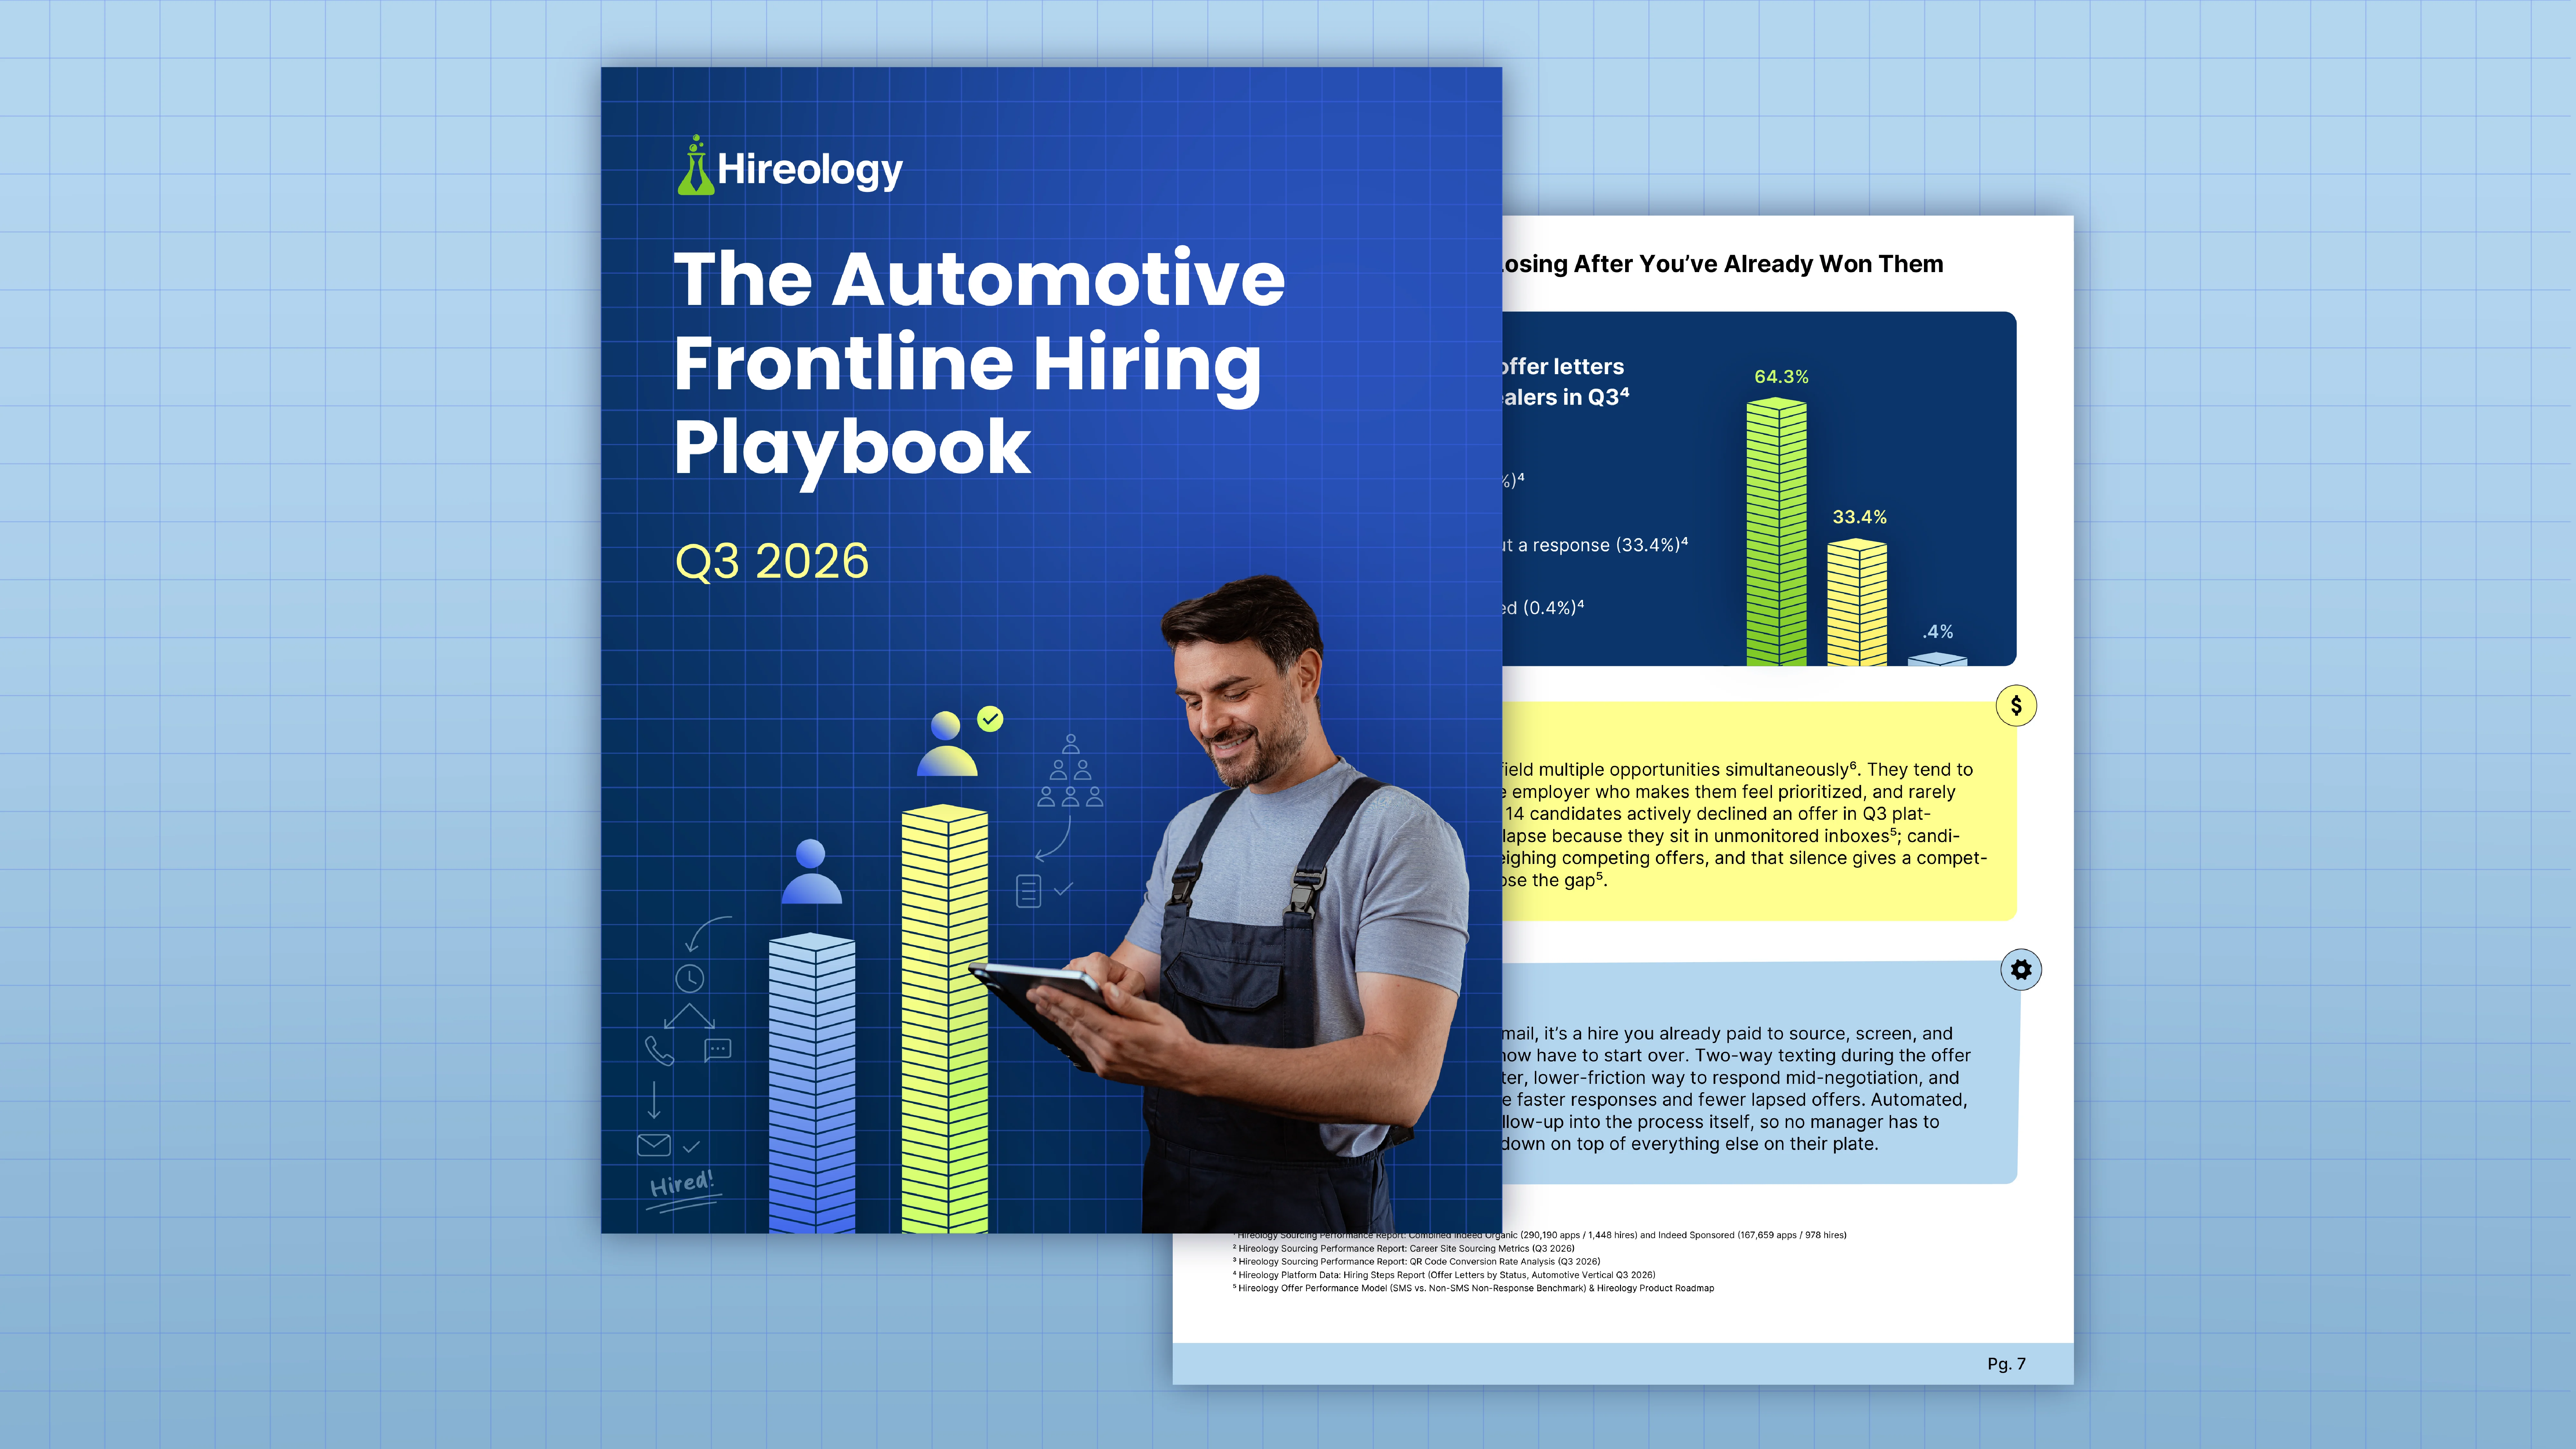
Speed before the offer does not help if the offer sits. In Q2, 30.7% of roles tied to an unanswered offer were never filled. Another 50.8% were eventually filled, but the hire took a median of 10 additional days and the process restarted. Unanswered offers sat a median of seven days before expiring, and fewer than one in five received operator follow-up.
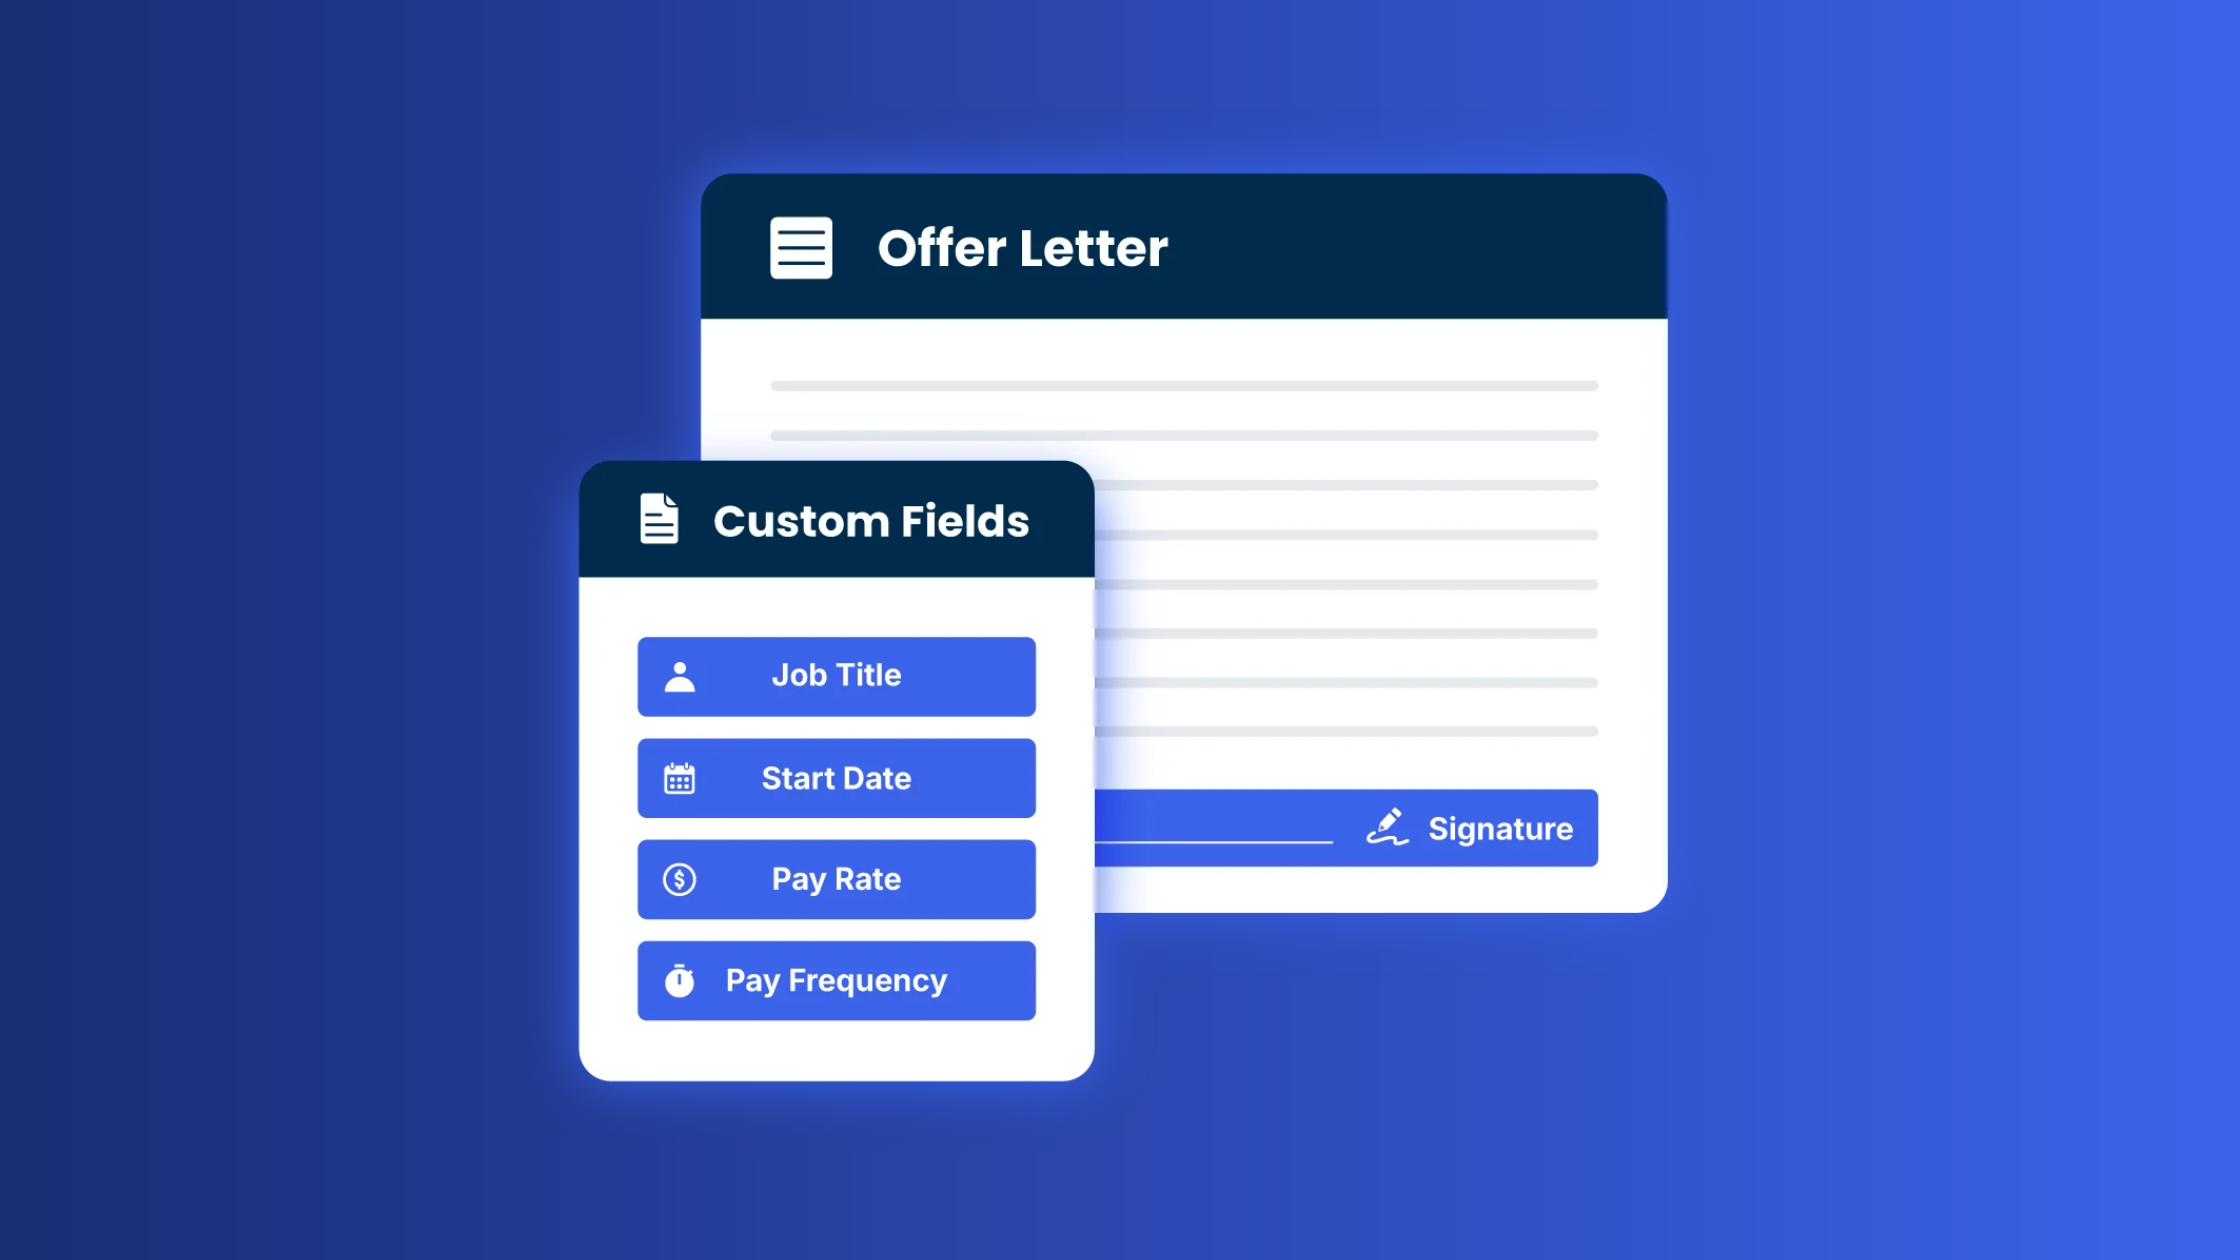
Enhanced Offer Letters, powered by DocuSign, covers that stage inside the Hireology hiring workflow. Send a finalized document, or generate an offer with conditional content that changes by role, location, or compensation, so a multi-location group does not maintain a separate template for every scenario. Route the offer for internal approval, and correct, resend, or void it after it goes out if pay or a start date changes. Automated reminders reach the candidate before the offer expires, on the timing and frequency you set, so follow-up no longer depends on a recruiter memory of tasks.
Five changes to make this week
- Clear the unreviewed pile first. Filter your applicants to October and not yet reviewed, and work through that list before you open another requisition. Use AI Match to manage the list of candidates and AI Candidate Summary to review their qualifications. Within Hireology's Action Center, focus on the Delayed Review Time list, it shows which jobs to open first.
- Audit your unanswered offers. Count the offers that expired without a response last quarter and how many got a follow-up. Then set reminders inside each offer's expiration window so no offer sits unanswered. Action Center shows offer status for each candidate, start with the roles that already have an offer out.
- Put the pay range in every posting. About half of October postings advertised no salary. Show the range on each role, starting with the ones you have reposted.
- Set your Action Center alerts on the roles that cost you most. Turn on Low Applicant Flow, and No Hires Made, and set the review threshold at three days.
- Find where applicants stall by location and hiring manager. Open the Hiring Funnel in Insights to see how many applicants move from applied to reviewed to candidate, then check User Activity to see which hiring managers are holding the delay. Start with the location that has the lowest reviewed share.
One Number to Pull Before November
The BLS publishes the November report on December 4. Before then, each location should be able to answer one question: how many people applied in October and heard nothing?
Compare that share against the 27.5% platform rate. A location above it has an inbox problem. A location below it can still lose days between review and first outreach, which is the 3.7-day gap in the platform averages. Hireology's hiring velocity dashboard shows time to review, first outreach, and hire by job role, so you can see which roles are losing days.
Sources
- BLS Employment Situation, October 2026, released November 6, 2026
- BLS Employment Situation, September 2026, released October 2, 2026
- Lightcast Job Posting Analytics, United States, Q4 2026 data set, October 2026
- Hireology platform data, hiring velocity dashboard, September and October 2026
- Hireology AI features and customer results
- Hireology Enhanced Offer Letters positioning document, including Q2 unanswered-offer data